The nASAP also contains a command line program which is more flexibility to use. Building and installing the command line program is very straight-forward.
Exemplified below is the application of the network analysis for identification, visualization and comparison of enhancer-gene interactions in different cell lines.
1. Generate a env.yml config file and add the below contents in file.
name: nasap_env
dependencies:
- libcurl=7.87.0
- scipy=1.5.2
- pandas=1.1.5
- hvplot=0.7.3
- pip=21.2.2
- bioconda::deeptools=2.5.7
- bioconda::pybigwig=0.3.17
- bioconda::pysam=0.8.3
- bioconda::bioawk=1.0
- bioconda::bedtools=2.30.0
- bioconda::bowtie2=2.3.5.1
- bioconda::fastp=0.22.0
- bioconda::flash=1.2.11
- bioconda::fastq-pair=1.0
- bioconda::samtools=1.13
- pip:
  - nasap==0.2.10
  - pyGenomeTracks==3.6
2. Create and activate conda env.
conda env create -f env.yml
conda activate nasap_env
nasap --help
3. Download the network analysis example data here.
4. Compute network based on expression file in a given sample and annotated functional connections of TF-gene and enhancer-gene.
nasap network_analysis --tf_source ./Homo_sapiens.GRCh38_tf_target.txt --enhancer_source ./Homo_sapiens.GRCh38_enhancer_target.txt --express_file ./express.csv --output_root ./test_output/
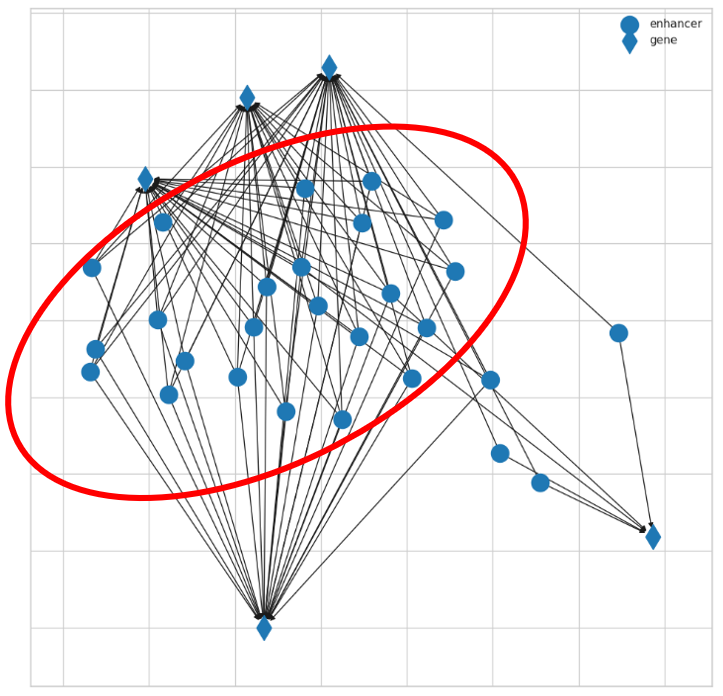
5. Find the network community for a genomic region of your interest, for example, chr8:144700000⇢chr8:144900000.
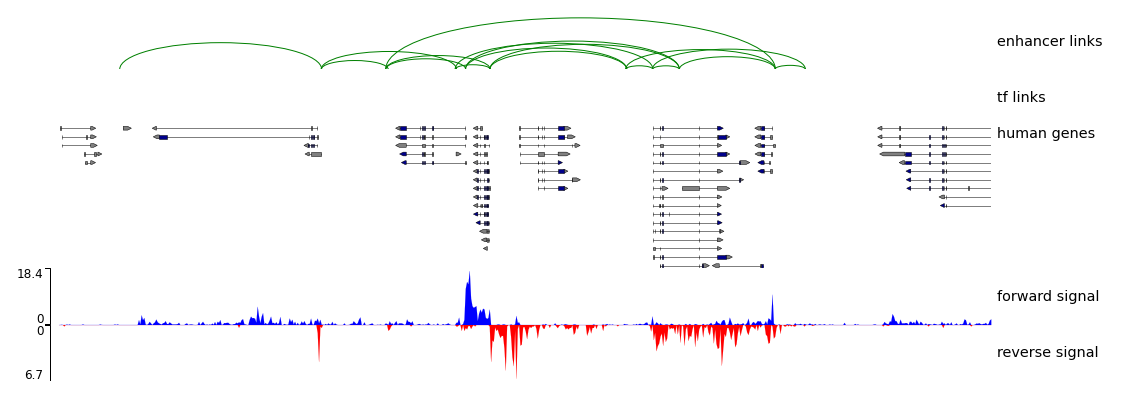
6. Visualization of the enhancer-gene interaction on genome browser.
nasap network_links --specie human --gtf ./Homo_sapiens.GRCh38.93.gtf --forward_bw ./forward.bw --reverse_bw ./reverse.bw --region chr8:144700000-144900000 --output_root ./test_output/
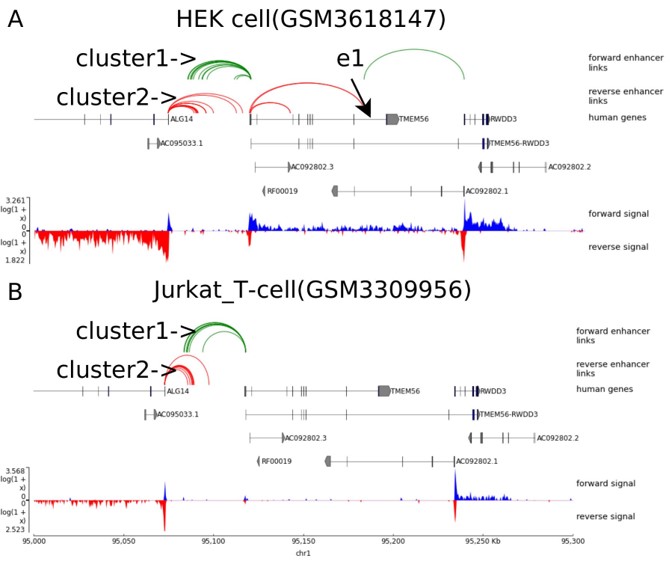
7. We can further identify differential enhancer-gene interactions if networks are built for two different samples, for example, HEK and Jurkat_T cells.
If you want to get more parameters usage, please refer to the python package manual.